Sequence from spectrum
[1]:
# Import auxiliary libraries for demonstration

import matplotlib as mpl
import matplotlib.pyplot as plt
import numpy as np

plt.rcParams[ "figure.figsize" ] = [ 5, 4 ]

plt.rcParams[ "figure.dpi" ] = 80
plt.rcParams[ "font.family" ] = "Times New Roman"
plt.rcParams[ "font.size" ] = '14'
Spectral representation
Function spectralRepresentation implements the harmonic superposition function.
Function help
[2]:
from ffpack.lsg import spectralRepresentation
help( spectralRepresentation )
Help on function spectralRepresentation in module ffpack.lsg.sequenceFromSpectrum:

spectralRepresentation(fs, time, freq, psd, freqBandwidth=None, randomSeed=None)
    Generate a sequence from a given power spectrum density with spectral
    representation method.

    Parameters
    ----------
    fs: scalar
        Sampling frequency.
    time: scalar
        Total sampling time.
    freq: 1darray
        Frequency array for psd.
        The freq array should be in equally spaced increasing.
    psd: 1darray
        Power spectrum density array.
    freqBandwidth: scalar, optional
        Frequency bandwidth used to generate the time series from psd.
        Default to None, every frequency in freq will be used.
    randomSeed: integer, optional
        Random seed. If randomSeed is none or is not an integer, the random seed in
        global config will be used.

    Returns
    -------
    ts: 1darray
        Array containing all the time data for the time series.
    amps: 1darray
        Amplitude array containing the amplitudes of the time series
        corresponding to ts.

    Raises
    ------
    ValueError
        If the fs or time is not a scalar.
        If freq or psd is not a 1darray or has less than 3 elements.
        If freq and psd are in different lengths.
        If freq contains negative elements.
        If freq is not equally spaced increasing.

    Examples
    --------
    >>> from ffpack.lsg import spectralRepresentation
    >>> fs = 100
    >>> time = 10
    >>> freq = [ 0, 0.1, 0.2, 0.3, 0.4, 0.5 ]
    >>> psd = [ 0.01, 2, 0.05, 0.04, 0.01, 0.03 ]
    >>> ts, amps = spectralRepresentation( fs, time, freq, psd, freqBandwidth=None )
Example with generated sequence
Generate sequence with two peak frequencies for psd
[3]:
gfs = 500   # sampling frequency
fs1 = 20    # first signal component at 20 Hz
fs2 = 80    # second signal component at 80 Hz
T = 10      # 10s signal length
n0 = -10    # noise level (dB)
[4]:
t = np.r_[ 0: T: ( 1 / gfs ) ]  # sample time
gdata = np.sin( 2 * fs1 * np.pi * t ) + np.sin( 2 * fs2 * np.pi * t )
gdata += np.random.randn( len( gdata ) ) * 10**( n0 / 20.0 )
[5]:
from ffpack.lsm import periodogramSpectrum
gfreq, gpsd = periodogramSpectrum( gdata, gfs )
Use the psd to generate time series
[6]:
fs = 500
time = 10
ts, amps = spectralRepresentation( fs, time, gfreq, gpsd, randomSeed=2023 )
[7]:
fig, ax = plt.subplots()

ax.plot( np.array( ts ),
         np.array( amps ) )

ax.tick_params(axis='x', direction="in", length=5)
ax.tick_params(axis='y', direction="in", length=5)
ax.tick_params(axis='x', direction="in", length=3, which='minor')
ax.tick_params(axis='y', direction="in", length=3, which='minor')

ax.set_xlabel( "Time [s]" )
ax.set_ylabel( "Amplitude" )
ax.set_title( "Generated time series" )

plt.tight_layout()
plt.show()

Generated sequence to spectrum
[8]:
sfreq, spsd = periodogramSpectrum( amps, fs )
[9]:
fig, ( ax1, ax2 ) = plt.subplots( 1, 2, figsize=( 10, 4 ) )
plt.yscale("log")

ax1.semilogy( np.array( sfreq ),
             np.array( spsd ) )
ax1.tick_params(axis='x', direction="in", length=5)
ax1.tick_params(axis='y', direction="in", length=5)
ax1.tick_params(axis='x', direction="in", length=3, which='minor')
ax1.tick_params(axis='y', direction="in", length=3, which='minor')
ax1.set_ylim( [ 1e-7, 1e2 ] )
ax1.set_xlim( [ 0, 100 ] )
ax1.set_xlabel( "Frequency [Hz]" )
ax1.set_ylabel( "PSD [V**2/Hz]" )
ax1.set_title( "Spectrum from Generated sequence" )


ax2.semilogy( np.array( gfreq ),
             np.array( gpsd ) )
ax2.tick_params(axis='x', direction="in", length=5)
ax2.tick_params(axis='y', direction="in", length=5)
ax2.tick_params(axis='x', direction="in", length=3, which='minor')
ax2.tick_params(axis='y', direction="in", length=3, which='minor')
ax2.set_ylim( [ 1e-7, 1e2 ] )
ax2.set_xlim( [ 0, 100 ] )
ax2.set_xlabel( "Frequency [Hz]" )
ax2.set_ylabel( "PSD [V**2/Hz]" )
ax2.set_title( "Spectrum from Original sequence" )

plt.tight_layout()
plt.show()

[10]:
ind = np.argpartition( spsd, -2 )[ -2: ]
peak1 = min( sfreq[ ind ] )
peak2 = max( sfreq[ ind ] )
print( "Peak frequences - Generated sequence" )
print( [ peak1, peak2 ] )

ind = np.argpartition( gpsd, -2 )[ -2: ]
peak1 = min( gfreq[ ind ] )
peak2 = max( gfreq[ ind ] )
print( "\nPeak frequences - Original sequence" )
print( [ peak1, peak2 ] )
Peak frequences - Generated sequence
[20.0, 80.0]

Peak frequences - Original sequence
[20.0, 80.0]
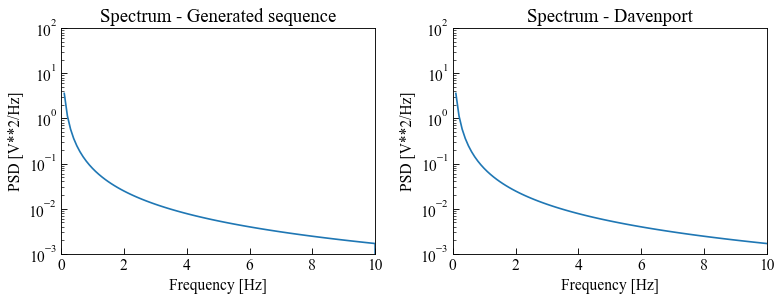
Example with Davenport spectrum
[11]:
from ffpack.lsm import davenportSpectrumWithRoughnessLength

dsrnfRange = np.linspace( 0.1, 10, num=100 )
[12]:
uz = 10
dsrnfResults = [ davenportSpectrumWithRoughnessLength( n, uz, normalized=False )
                 for n in dsrnfRange ]
[13]:
dfs = 500
time = 10
dts, damps = spectralRepresentation( dfs, time, dsrnfRange,
                                     dsrnfResults, randomSeed=2023 )
[14]:
fig, ax = plt.subplots()

ax.plot( np.array( dts ),
         np.array( damps ) )

ax.tick_params(axis='x', direction="in", length=5)
ax.tick_params(axis='y', direction="in", length=5)
ax.tick_params(axis='x', direction="in", length=3, which='minor')
ax.tick_params(axis='y', direction="in", length=3, which='minor')

ax.set_xlabel( "Time [s]" )
ax.set_ylabel( "Amplitude" )
ax.set_title( "Generated time series" )

plt.tight_layout()
plt.show()

[15]:
dsfreq, dspsd = periodogramSpectrum( damps, dfs )
[16]:
fig, ( ax1, ax2 ) = plt.subplots( 1, 2, figsize=( 10, 4 ) )

ax1.semilogy( np.array( dsfreq[ 1: -10 ] ),
              np.array( dspsd[ 1: -10 ] ) )
ax1.tick_params(axis='x', direction="in", length=5)
ax1.tick_params(axis='y', direction="in", length=5)
ax1.tick_params(axis='x', direction="in", length=3, which='minor')
ax1.tick_params(axis='y', direction="in", length=3, which='minor')
ax1.set_ylim( [ 1e-3, 1e2 ] )
ax1.set_xlim( [ 0, 10 ] )
ax1.set_xlabel( "Frequency [Hz]" )
ax1.set_ylabel( "PSD [V**2/Hz]" )
ax1.set_title( "Spectrum - Generated sequence" )

ax2.semilogy( np.array( dsrnfRange ),
              np.array( dsrnfResults ) )
ax2.tick_params(axis='x', direction="in", length=5)
ax2.tick_params(axis='y', direction="in", length=5)
ax2.tick_params(axis='x', direction="in", length=3, which='minor')
ax2.tick_params(axis='y', direction="in", length=3, which='minor')
ax2.set_ylim( [ 1e-3, 1e2 ] )
ax2.set_xlim( [ 0, 10 ] )
ax2.set_xlabel( "Frequency [Hz]" )
ax2.set_ylabel( "PSD [V**2/Hz]" )
ax2.set_title( "Spectrum - Davenport" )

plt.tight_layout()
plt.show()